Reflecting on the price action over this shortened holiday week, I’m struck by how the leadership trends have not really changed too much. We’ve observed bombed-out market breadth indicators, and the S&P 500 remains clearly below its 200-day moving average despite a strong upside swing off the early April market low.
But how much as the leadership of this market changed over the last couple weeks? I would argue that conditions remain fairly consistent over that period, and are still not overwhelmingly bullish.
Defensive Sectors Still Outperforming Offense
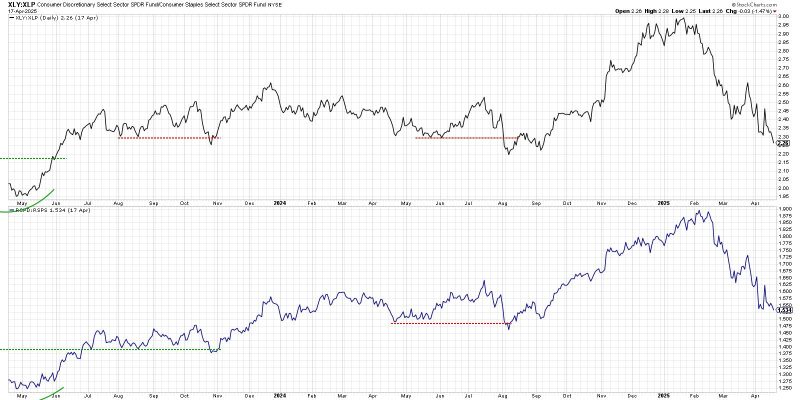
Here’s one of my favorite charts for analyzing offense vs. defense, a chart that holds a place of honor on my Market Misbehavior LIVE ChartList. We’re comparing the Consumer Discretionary and Consumer Staples using both cap-weighted and equal-weighted ETFs.
When the ratios are going higher, investors are favoring “things you want” over “things you need”, which implies optimism for economic growth. When the ratios slope lower, that suggests more defensive positioning as investors are skeptical of growth prospects.
We can see that the cap-weighted version of this ratio made a peak in January, while the equal-weighted version made its own top in February. Both ratios have been in a fairly consistent downtrend of lower highs and lower lows, even through last week’s sudden spike on tariff policy changes.
How bullish do I want to be when these ratios are sloping lower? Generally speaking, I’ve found that until investors start believing in the upside potential of Consumer Discretionary over the relative defense of Consumer Staples, it’s best to remain on the sidelines.
Using the RRG to Visualize Offense vs. Defense
While I often refer to relative strength ratios of sector ETFs vs. the S&P 500 index, I also enjoy leveraging the power of Relative Rotation Graphs (RRG®) to monitor a series of relative strength ratios in one simple but powerful visualization.
Here, I’m showing the 11 S&P 500 economic sectors relative to the S&P 500, and I’m highlighting Consumer Discretionary and Consumer Staples to monitor their relative positions. If you click “Animate” for this visualization, you’ll see that toward the end of 2024, offense was clearly outperforming defense. The XLY was in the Leading quadrant, the XLP was in the Lagging quadrant, and the rotations suggested a classic bull market configuration.
Fast-forward to February and March and you’ll see how Consumer Discretionary rotated into the Weakening and then Lagging quadrant. Meanwhile, Consumer Staples strengthened during that same period. At this point, the RRG is telling me defense over offense, in a classic bearish configuration.
Sticking With Groceries, Guns, and Gold
So, given the bearish leadership configuration in spite of a sudden bounce of the April market low, where can we find potential opportunities? I’ll highlight three ideas that I’ll summarize as “Groceries, Guns, and Gold.”
Playing off the “things you need” theme implied above, grocery retailer Kroger Co. (KR) has managed to pound out a fairly consistent pattern of higher highs and higher lows. With improving momentum and a new 12-month relative high this week, this is a chart continuing in a clear uptrend despite broad market weakness. By the way, KR was one of the Top Ten Charts for April 2025 I presented with Grayson Roze!
Defense stocks like Northrop Grumman Corp. (NOC) have experienced an upside resurgence given geopolitical instability in 2025. From a technical perspective, I love how charts like NOC have rallied since mid-February, while most stocks, as well as our equity benchmarks, have been trending lower! There’s a significant resistance level to overcome around $550, but a confirmed break higher could open the door to further gains.
Gold has experienced an incredible run so far in 2025, finishing the week up 26% for the year compared to the S&P 500’s 10% loss over the same period. Similar to the chart of NOC, Newmont Corporation (NEM) is addressing a key resistance level from a major high in October 2024. But, so far in 2025, NEM has been scoring higher highs and higher lows, potentially building momentum for a break to a new all-time high.
It can be super tempting to consider the April low as “the bottom” and go all-in on growth stocks and offensive plays. But, given the lack of leadership rotation in April, I’m inclined to stick with charts that remain in strong uptrends during uncertain times.
RR#6,
Dave
P.S. Ready to upgrade your investment process? Check out my free behavioral investing course!
David Keller, CMT
President and Chief Strategist
Sierra Alpha Research LLC
Disclaimer: This blog is for educational purposes only and should not be construed as financial advice. The ideas and strategies should never be used without first assessing your own personal and financial situation, or without consulting a financial professional.
The author does not have a position in mentioned securities at the time of publication. Any opinions expressed herein are solely those of the author and do not in any way represent the views or opinions of any other person or entity.

