Insightful Trader Tips
  • Finances
  • World News
  • Investing
  • Stock
Stock

Why Investors Are Flocking to XPEV Stock: Decoding High SCTR Scores

by March 7, 2025
March 7, 2025

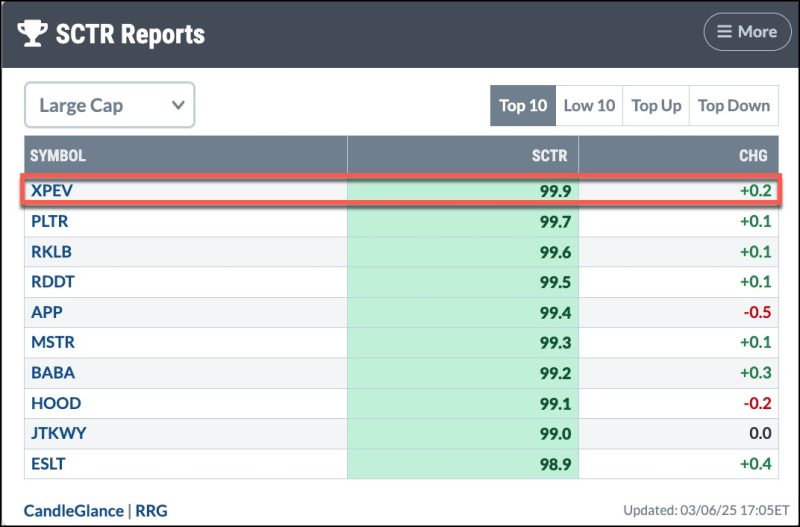
And, the Oscar, er, top StockCharts Technical Rank (SCTR) goes to XPeng, Inc. (XPEV), a Chinese smart electric vehicle (EV) manufacturer. XPEV has silently crept its way to the top of the list.

The Chinese EV industry has seen increased sales in the last month. This has made the space much more competitive for Tesla, Inc. (TSLA), which is seeing its sales in China decline. With XPeng’s new SUV slated to hit the market soon, XPEV has high hopes for 2025. I’m sure we’ll hear more about this when the company announces earnings on March 18, before the US market opens.

XPeng’s stock price has been rising steadily since August 2024, attracting the attention of several Wall Street analysts, many of whom have upped their ratings on the stock. And for good reason. The chart below compares XPEV stock to TSLA stock. Since mid-December, TSLA’s stock price (black solid line) has declined while XPEV’s has risen.

FIGURE 1. XPEV’S STOCK PRICE VS. TSLA’S STOCK PRICE. TSLA was the outperformer until mid-December, after which it started declining. In February 2025, XPEV outperformed TSLA.Chart source: StockCharts.com. For educational purposes.

Technically, XPEV has a lot going for it.

The stock is in a steady uptrend—its one-year performance is +132.81%.
XPEV’s SCTR score of 99.9 indicates the stock is technically strong.
The relative strength index (RSI) has just crossed 70, indicating there’s room for XPEV’s stock price to move higher.

The daily chart shows the stock price is trading close to its 52-week high of $22.80. A breakout above this level would be positive for the stock and could pave the way for the stock price to move toward its all-time high of $74.49. Let’s switch to the weekly chart of XPEV.

The weekly chart below shows XPEV’s stock price is approaching its weekly July 2023 high, which could be the more likely resistance level XPEV would have to break through.

FIGURE 2. WEEKLY CHART OF XPEV’S STOCK PRICE. The stock price is approaching its 2023 weekly high, which could act as a resistance level. The percentage price oscillator in the lower panel indicates strong momentum in the stock’s price.Chart source: StockCharts.com. For educational purposes.

The percentage price oscillator (PPO) in the lower panel shows the stock has had strong upside momentum and could be overbought. A pullback in the stock’s price is likely to occur. If this pans out and XPEV reverses and pushes through the resistance on the weekly chart with a strong upside follow-through, it would be worth adding XPEV to your portfolio.

Keep an eye on this one. At the rate smart EVs are going, don’t be surprised to find flying cars coming to dealerships.

Disclaimer: This blog is for educational purposes only and should not be construed as financial advice. The ideas and strategies should never be used without first assessing your own personal and financial situation, or without consulting a financial professional.
previous post
Market Movers in Action: How to Identify High-Probability Dip-Buying Setups
next post
Supplementary Bidder’s Statement

Related Posts

Navigate the Stock Market with Confidence

June 17, 2025

Diving into Energy Investments: Uncover Hidden Gems Today!

June 17, 2025

Major Shift in the Markets! Here’s Where the...

June 17, 2025

The Best Five Sectors, #23

June 16, 2025

Week Ahead: NIFTY May Continue Showing Resilience; Broader...

June 15, 2025

Bearish Divergence Suggests Caution For S&P 500

June 14, 2025

Is a Bold Rotation Brewing in Healthcare and...

June 14, 2025

Three Sectors Stand Out and One Sports a...

June 14, 2025

RRG Update: Is Tech Ready to Break Out?

June 13, 2025

What the S&P 500, VIX, and ARKK are...

June 13, 2025

Investing

  • Mobile Gaming Stocks: 10 Biggest Companies in 2025

    June 17, 2025
  • Critical One Sells Uranium Assets to Dark Star, Hones Focus on Antimony-Gold Project

    June 17, 2025
  • Significant Uranium anomalies identified across the NT

    June 17, 2025
  • Jp Cortez: Is America’s Gold Really There? US Needs Full Audit of Reserves

    June 16, 2025
  • Jp Cortez: Is America’s Gold Really There? US Needs Full Audit of Reserves

    June 16, 2025

Disclaimer: InsightfulTraderTips.com, its managers, its employees, and assigns (collectively “The Company”) do not make any guarantee or warranty about what is advertised above. Information provided by this website is for research purposes only and should not be considered as personalized financial advice. The Company is not affiliated with, nor does it receive compensation from, any specific security. The Company is not registered or licensed by any governing body in any jurisdiction to give investing advice or provide investment recommendation. Any investments recommended here should be taken into consideration only after consulting with your investment advisor and after reviewing the prospectus or financial statements of the company.

    Become a VIP member by signing up for our newsletter. Enjoy exclusive content, early access to sales, and special offers just for you! As a VIP, you'll receive personalized updates, loyalty rewards, and invitations to private events. Elevate your experience and join our exclusive community today!


    By opting in you agree to receive emails from us and our affiliates. Your information is secure and your privacy is protected.

    • About us
    • Privacy Policy
    • Terms & Conditions

    Copyright © 2025 InsightfulTraderTips.com All Rights Reserved.

    Insightful Trader Tips
    • Finances
    • World News
    • Investing
    • Stock
    Insightful Trader Tips
    • Finances
    • World News
    • Investing
    • Stock
    Copyright © 2025 InsightfulTraderTips.com All Rights Reserved.