Insightful Trader Tips
  • Finances
  • World News
  • Investing
  • Stock
Stock

Cybersecurity Makes Yet Another Statement

by February 1, 2025
February 1, 2025

The Cybersecurity ETF (CIBR) has been leading the market for a solid four months and recorded yet another new high this week. Chartists looking to take advantage of this leadership can use two timeframes: one to establish the absolute and relative trends, and another to identify tradable pullbacks along the way. Note that CIBR has been on our radar for four months and was featured in October.  

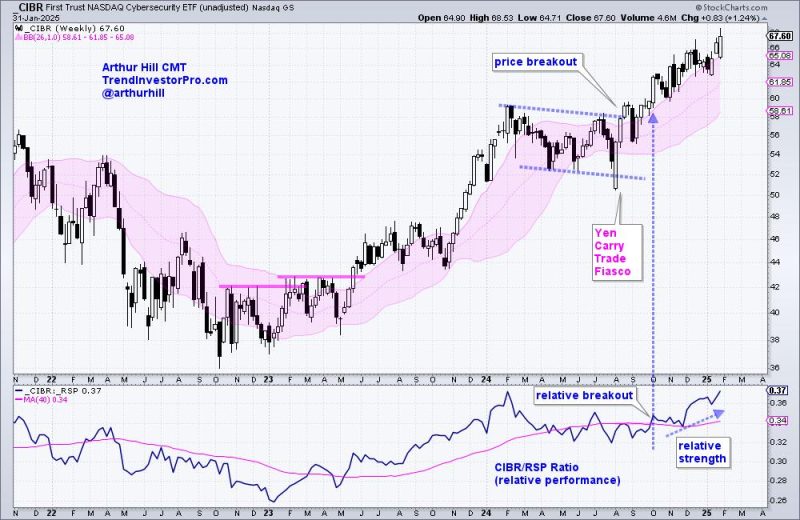
The first chart shows weekly candlesticks over the last three years. CIBR surged from November-2023 to January 2024 and then formed a long consolidation pattern from February to September. CIBR broke consolidation resistance at 58 in September (price breakout) and closed above 68 this week. This breakout opened to door to the current run.  

The indicator window shows the CIBR/RSP ratio to measure relative performance. This ratio rises when CIBR outperforms the broader market (S&P 500 EW ETF (RSP)) and falls when CIBR underperforms. This ratio broke out in early October to signal relative strength in CIBR (relative breakout). The price breakout and relative breakout proved a power combination. Keep this in mind.

With CIBR in an uptrend and leading in October, chartists can turn to daily charts to identify tradable patterns along the way. For patterns, we can use flags and pennants, which are short-term bullish continuation patterns. Most recently, CIBR broke out of a pennant in mid January and this foreshadowed the run to new highs. We highlighted this pattern in our Chart Trader report as it took shape in mid January.

Chartists can also use indicators to identify tradable pullbacks within a strong uptrend. The bottom window shows Percent-B, which dips below 0 when the close is below the lower Bollinger Band (20,2). This is a “true” oversold condition because price is more than two standard deviations below the 20-day SMA. Percent-B, however, did not dip below zero and become truly oversold. Instead, it became moderately oversold with dips below .20 on December 31st and January 13th. We have to take what the market gives us. This moderately oversold condition coincided with the flag and pennant patterns.  

This week at TrendInvestorPro we analyzed three AI ETFs that cover three distinct areas (AI infrastructure, physical AI, AI software and apps). Our reports and video also highlighted leadership in ETFs related to Cloud Computing and Software, as well as the recent breakout in the Biotech ETF. Click here to learn more and gain immediate access. 

///////////////////////////////////////////////////
previous post
The Best Five Sectors, #5
next post
SP600 (IJR) Silver Cross BUY Signal May Arrive Too Late

Related Posts

Tech ETFs are Leading Since April, but Another...

June 8, 2025

Week Ahead: NIFTY’s Behavior Against This Level Crucial...

June 7, 2025

From Tariffs to Tech: Where Smart Money’s Moving...

June 7, 2025

Your Weekly Stock Market Snapshot: What It Means...

June 7, 2025

Big Rally Ahead Should Yield All-Time High on...

June 7, 2025

Everyone Talks About Leaving a Better Planet for...

June 7, 2025

Silver’s Surge is No Fluke—Here’s the Strange Ratio...

June 7, 2025

Three Charts Showing Proper Moving Average Alignment

June 6, 2025

Clusters of Long Winning Streaks: What They’re Telling...

June 6, 2025

S&P 500 on the Verge of 6,000: What’s...

June 5, 2025

Investing

  • Editor’s Picks: Marathon Project Gets Nod, Rio Tinto Opens Western Range, Indonesia Probes Nickel Mining

    June 7, 2025
  • Top 5 Canadian Mining Stocks This Week: Africa Energy Jumps 275 Percent

    June 7, 2025
  • Crypto Market Recap: Strategy Eyes US$1 Billion Capital Raise, Uber Considers Stablecoin Usage

    June 6, 2025
  • Ford Government Pushes Bill 5 Through Legislature, Sparking First Nations Outcry

    June 6, 2025
  • Hempalta Provides Strategic Update Regarding Equipment Sale and FCC Agreement

    June 6, 2025

Disclaimer: InsightfulTraderTips.com, its managers, its employees, and assigns (collectively “The Company”) do not make any guarantee or warranty about what is advertised above. Information provided by this website is for research purposes only and should not be considered as personalized financial advice. The Company is not affiliated with, nor does it receive compensation from, any specific security. The Company is not registered or licensed by any governing body in any jurisdiction to give investing advice or provide investment recommendation. Any investments recommended here should be taken into consideration only after consulting with your investment advisor and after reviewing the prospectus or financial statements of the company.

    Become a VIP member by signing up for our newsletter. Enjoy exclusive content, early access to sales, and special offers just for you! As a VIP, you'll receive personalized updates, loyalty rewards, and invitations to private events. Elevate your experience and join our exclusive community today!


    By opting in you agree to receive emails from us and our affiliates. Your information is secure and your privacy is protected.

    • About us
    • Privacy Policy
    • Terms & Conditions

    Copyright © 2025 InsightfulTraderTips.com All Rights Reserved.

    Insightful Trader Tips
    • Finances
    • World News
    • Investing
    • Stock
    Insightful Trader Tips
    • Finances
    • World News
    • Investing
    • Stock
    Copyright © 2025 InsightfulTraderTips.com All Rights Reserved.