Insightful Trader Tips
  • Finances
  • World News
  • Investing
  • Stock
Stock

Mid-Caps Make a Statement with a Breadth Thrust

by January 19, 2025
January 19, 2025

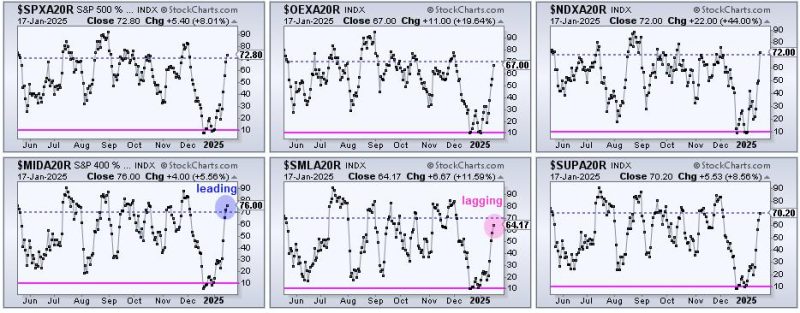
Mid-caps show leadership and were the first to trigger a breadth thrust. Stocks surged this week with mid-caps showing the highest participation rate. Chartists can quantify the participation rate and identify breadth thrusts using the percentage of stocks above their 20-day SMAs. We will analyze these indicators for six broad indexes and show the breadth thrust for the S&P MidCap 400.

Chart Link

The CandleGlance charts above show the percentage of stocks above their 20-day SMAs for the S&P 500, S&P 100, Nasdaq 100, S&P MidCap 400, S&P SmallCap 600 and S&P 1500. We can identify the leaders and the laggards by comparing values. Mid-caps are leading as S&P MidCap 400 Percent Above 20-day SMA ($MIDA20R) surged to 76 percent (blue circle), the highest of the six. This means 76 percent of its component stocks are above their 20-day SMAs. This is a big change because this number was below 10% in mid December. Small-caps are lagging as $SMLA20R finished at 64.17 percent (pink circle). Everything else is in between.

Chart Link

The chart above shows S&P MidCap 400 Percent Above 20-day SMA ($MIDA20R) in the top window with the oversold line at 10 percent (pink) and the thrust line at 70 percent (blue). This indicator formed a bullish divergence and then triggered a breadth thrust on Thursday. A move below 10 percent marks a downside extreme that signals an oversold condition (pink shading). Stocks, however, can become oversold, and remain oversold. Therefore, we need to wait for an upside catalyst. A subsequent move above 70% (blue dashed lines) shows a participation thrust, which means the vast majority of component stocks participated in this advance. Broad participation is bullish. $MIDA20R was the first of the six to cross above 70 percent.

At TrendInvestorPro, we pointed out oversold breadth in December and featured the divergence in Tuesday’s report. A divergence forms when the underlying index ETF (MDY) forges lower lows and the indicator forms higher lows (blue lines). MDY fell from mid December to mid January (lower lows), but fewer stocks within the index moved below their 20-day SMAs during this timeframe. Put another way, more stocks held above their 20-day SMAs. Divergences in March and October 2023 also preceded breadth thrusts.

This week at TrendInvestorPro we covered six Market Regime charts on Wednesday and highlighted seven leading ETFs om Friday’s report/video. Leadership is coming from the middle of the market, and specifically from three sectors. Click here to take a trial and get immediate access.

/////////////////////////////////////////////////
previous post
Brazil’s Bolsonaro frustrated after court blocks attendance at Trump’s inauguration
next post
The Best Five Sectors, #3

Related Posts

Week Ahead: NIFTY’s Behavior Against This Level Crucial...

June 7, 2025

From Tariffs to Tech: Where Smart Money’s Moving...

June 7, 2025

Your Weekly Stock Market Snapshot: What It Means...

June 7, 2025

Big Rally Ahead Should Yield All-Time High on...

June 7, 2025

Everyone Talks About Leaving a Better Planet for...

June 7, 2025

Silver’s Surge is No Fluke—Here’s the Strange Ratio...

June 7, 2025

Three Charts Showing Proper Moving Average Alignment

June 6, 2025

Clusters of Long Winning Streaks: What They’re Telling...

June 6, 2025

S&P 500 on the Verge of 6,000: What’s...

June 5, 2025

Why ADX Can Mislead You — And How...

June 5, 2025

Investing

  • Editor’s Picks: Marathon Project Gets Nod, Rio Tinto Opens Western Range, Indonesia Probes Nickel Mining

    June 7, 2025
  • Top 5 Canadian Mining Stocks This Week: Africa Energy Jumps 275 Percent

    June 7, 2025
  • Crypto Market Recap: Strategy Eyes US$1 Billion Capital Raise, Uber Considers Stablecoin Usage

    June 6, 2025
  • Ford Government Pushes Bill 5 Through Legislature, Sparking First Nations Outcry

    June 6, 2025
  • Hempalta Provides Strategic Update Regarding Equipment Sale and FCC Agreement

    June 6, 2025

Disclaimer: InsightfulTraderTips.com, its managers, its employees, and assigns (collectively “The Company”) do not make any guarantee or warranty about what is advertised above. Information provided by this website is for research purposes only and should not be considered as personalized financial advice. The Company is not affiliated with, nor does it receive compensation from, any specific security. The Company is not registered or licensed by any governing body in any jurisdiction to give investing advice or provide investment recommendation. Any investments recommended here should be taken into consideration only after consulting with your investment advisor and after reviewing the prospectus or financial statements of the company.

    Become a VIP member by signing up for our newsletter. Enjoy exclusive content, early access to sales, and special offers just for you! As a VIP, you'll receive personalized updates, loyalty rewards, and invitations to private events. Elevate your experience and join our exclusive community today!


    By opting in you agree to receive emails from us and our affiliates. Your information is secure and your privacy is protected.

    • About us
    • Privacy Policy
    • Terms & Conditions

    Copyright © 2025 InsightfulTraderTips.com All Rights Reserved.

    Insightful Trader Tips
    • Finances
    • World News
    • Investing
    • Stock
    Insightful Trader Tips
    • Finances
    • World News
    • Investing
    • Stock
    Copyright © 2025 InsightfulTraderTips.com All Rights Reserved.