Insightful Trader Tips
  • Finances
  • World News
  • Investing
  • Stock
Stock

How to Trade Erratic Uptrends – An Example and Setup using IWM

by January 4, 2025
January 4, 2025

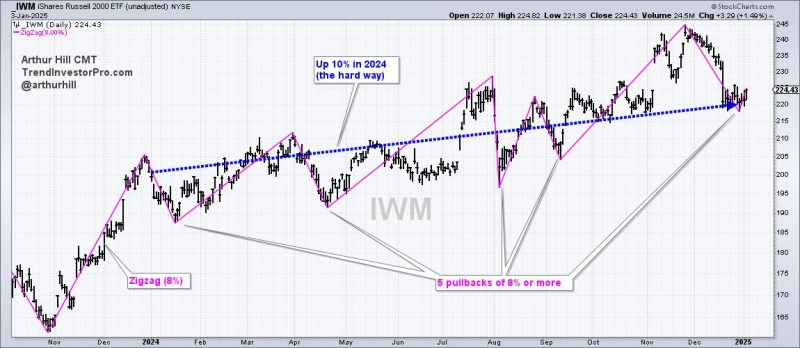
The Russell 2000 ETF managed a double-digit gain in 2024, but did it the hard way with several deep pullbacks. Pullbacks within uptrends are opportunities and we can find such opportunities using %B.

The chart below shows the Russell 2000 ETF (IWM) with the Zigzag(8) indicator. This indicator changes direction when there is a move greater than 8%, which means it ignores price moves that are less than 8%. I am showing this indicator to highlight five pullbacks of 8% or more in 2024. That’s a lot. In contrast, the S&P 500 SPDR (SPY) only experienced one 8+ percent pullback in early August.

Overall, IWM advanced 10% in 2024. That seems like a good year, but it was a “hard” 10% when we include the five 8+ percent pullbacks. This is simply the nature of small-cap stocks. They are less “trendy” than large-caps and have higher betas, making them more susceptible to wider fluctuations. Traders need to consider this when trading small-caps. As noted in Chart Trader this week, we see similar price action in the S&P 500 EW ETF (RSP) and S&P MidCap 400 SPDR (MDY).

Click here to take Chart Trader trial and get immediate access.

Buying upside breakouts is probably not the best strategy for trading IWM. Instead, traders should consider pullbacks and mean-reversion opportunities. We can identify such opportunities using Bollinger Bands (20,2) and %B (20,2). The middle line on the Bollinger Bands is the 20-day SMA and the bands are two standard deviations above and below. A close below the lower band means price fell two standard deviations and this creates an oversold condition.

Chartists can quantify oversold conditions using %B, which falls below 0 when the close is below the lower Bollinger Band. The blue lines on the chart above show %B dipping below 0 four times in 2024. Note that I would also only look for oversold conditions when price is above the 200-day SMA (long-term uptrend). When the bigger trend is up, a close below the lower Bollinger Band signals an oversold condition that can lead to a bounce.

December was a rough month for many stocks and ETFs. Even so, the weight of the evidence remains bullish for stocks and these pullbacks look like corrections within bigger uptrends. This week’s reports and videos focused on long-term breadth indicators, short-term oversold breadth, leading ETFs and a dozen ETFs with tradable pullbacks.

Click here to take a Chart Trader trial and get immediate access.

///////////////////////////////////////////////
previous post
These Riskier Areas Start the New Year RALLY!
next post
Chile’s President Boric leads journey to South Pole in historic trip

Related Posts

Tech ETFs are Leading Since April, but Another...

June 8, 2025

Week Ahead: NIFTY’s Behavior Against This Level Crucial...

June 7, 2025

From Tariffs to Tech: Where Smart Money’s Moving...

June 7, 2025

Your Weekly Stock Market Snapshot: What It Means...

June 7, 2025

Big Rally Ahead Should Yield All-Time High on...

June 7, 2025

Everyone Talks About Leaving a Better Planet for...

June 7, 2025

Silver’s Surge is No Fluke—Here’s the Strange Ratio...

June 7, 2025

Three Charts Showing Proper Moving Average Alignment

June 6, 2025

Clusters of Long Winning Streaks: What They’re Telling...

June 6, 2025

S&P 500 on the Verge of 6,000: What’s...

June 5, 2025

Investing

  • Editor’s Picks: Marathon Project Gets Nod, Rio Tinto Opens Western Range, Indonesia Probes Nickel Mining

    June 7, 2025
  • Top 5 Canadian Mining Stocks This Week: Africa Energy Jumps 275 Percent

    June 7, 2025
  • Crypto Market Recap: Strategy Eyes US$1 Billion Capital Raise, Uber Considers Stablecoin Usage

    June 6, 2025
  • Ford Government Pushes Bill 5 Through Legislature, Sparking First Nations Outcry

    June 6, 2025
  • Hempalta Provides Strategic Update Regarding Equipment Sale and FCC Agreement

    June 6, 2025

Disclaimer: InsightfulTraderTips.com, its managers, its employees, and assigns (collectively “The Company”) do not make any guarantee or warranty about what is advertised above. Information provided by this website is for research purposes only and should not be considered as personalized financial advice. The Company is not affiliated with, nor does it receive compensation from, any specific security. The Company is not registered or licensed by any governing body in any jurisdiction to give investing advice or provide investment recommendation. Any investments recommended here should be taken into consideration only after consulting with your investment advisor and after reviewing the prospectus or financial statements of the company.

    Become a VIP member by signing up for our newsletter. Enjoy exclusive content, early access to sales, and special offers just for you! As a VIP, you'll receive personalized updates, loyalty rewards, and invitations to private events. Elevate your experience and join our exclusive community today!


    By opting in you agree to receive emails from us and our affiliates. Your information is secure and your privacy is protected.

    • About us
    • Privacy Policy
    • Terms & Conditions

    Copyright © 2025 InsightfulTraderTips.com All Rights Reserved.

    Insightful Trader Tips
    • Finances
    • World News
    • Investing
    • Stock
    Insightful Trader Tips
    • Finances
    • World News
    • Investing
    • Stock
    Copyright © 2025 InsightfulTraderTips.com All Rights Reserved.